Data-Driven Expert Rankings: Implementing Review Metrics for Top Experts on Getkons
In the MVP I of Getkons, we introduced a user review feature that directly impacts the Top Expert and Recommended Expert functionalities for clients. The higher and more numerous the reviews an expert receives, the greater their likelihood of being featured in the Top Expert list or suggested in the Recommendation Engine for clients seeking experts. Experts with high scores benefit from increased visibility and project opportunities on the platform.
The objective of this research is to establish a foundational scoring system that evaluates experts and determines their eligibility for the Top Expert and Recommended Expert statuses, based on client reviews.

01
The Problem : Business X User Needs
Business Problem
Getkons, as a platform connecting clients with freelance experts, faces a challenge in presenting the most suitable and experienced experts to its clients. Without a clear evaluation system, clients struggle to find high-quality experts, while high-performing experts lack sufficient exposure. This could potentially lower client trust in the platform and reduce the number of projects assigned to top experts. A data-driven system that transparently and accurately ranks and recommends experts to clients is crucial.
Key challenges:
Lack of a clear ranking system for experts.
Limited visibility for top-performing experts.
Difficulty for clients in finding the most relevant experts for their projects.
User Problem
Both experts and clients face challenges that impact their satisfaction with the platform:
For Experts:
High-performing experts feel underexposed due to the absence of a fair ranking system to showcase them on the main page.
The unclear ranking factors make it hard for experts to understand how they can improve their profiles.
Experts require clear feedback to identify areas for improvement in order to secure more projects.
For Clients:
Clients struggle to find the best experts that fit their project needs efficiently.
Without a transparent review and ranking system, clients spend more time evaluating experts, leading to a less streamlined experience.
02
Metrics Review
Review is the evaluation given by a client after completing a project. Reviews are crucial for experts, as they directly impact account quality and rankings. Currently, users provide reviews using a star rating system (1-5), which results in a total score ranging from 1.0 to 5.0.
Moving forward, we aim to create a Scoring System that incorporates several key performance indicators (KPIs) that affect expert rankings. This system will act as the algorithm for determining Top Expert rankings, assigning weights to each KPI as follows:
Total years of experience (E): 0.2
Client rating (R): 0.4
Number of projects (P): 0.4
The total weight of all indicators equals 1.


03
Normalization and Scoring
Step 1: Minimal & Maximal Values per Indicator
To ensure fairness in scoring, each indicator has a minimum and maximum value:
Total years of experience (E): min 1, max 10
Client rating (R): min 1, max 5
Number of projects (P): min 2, max 30
Step 2: Data Normalization
Since these indicators may have different scales, it's essential to normalize the values to bring them to a uniform scale. For each indicator, we calculate the normalized value using the following formula:
normalized_value = (actual_value - min_value) / (max_value - min_value)
For example, the normalized value for years of experience would be calculated based on the range of 1 to 10 years.
Step 3: Apply Weights
Next, we multiply each normalized indicator value by its corresponding weight. This step ensures that each KPI contributes to the final score according to its importance.
weighted_value = normalized_value * weight
Step 4: Calculate Total Score
The overall score for each expert is then calculated by summing the weighted values from each indicator:
total_score = weighted_value_1 + weighted_value_2 + weighted_value_3
Step 5: Rank the Experts
Finally, experts are ranked based on their total scores in descending order. Experts with higher scores will be ranked higher, giving them better visibility on the platform.
Here’s an example to demonstrate how the system works:

Normalized Data:
User 1:
Normalized experience: (10 - 1) / (10 - 1) = 1
Normalized rating: (4 - 1) / (5 - 1) = 0.75
Normalized projects: (15 - 2) / (30 - 2) = 0.464
User 2:
Normalized experience: (8 - 1) / (10 - 1) = 0.78
Normalized rating: (3 - 1) / (5 - 1) = 0.5
Normalized projects: (10 - 2) / (30 - 2) = 0.285
Weighted Scores:
After applying the weights to the normalized values, the final scores for each user are calculated:
User 1: Total score = (1 * 0.2) + (0.75 * 0.4) + (0.464 * 0.4) = 0.786
User 2: Total score = (0.78 * 0.2) + (0.5 * 0.4) + (0.285 * 0.4) = 0.574
From this, we can rank the users based on their total scores.

04
Design Purpose
Following the research and scoring system development, we translated the metrics into the visual design of the Top Expert feature. We adjusted the UI to visually display the ranking and provide clarity on each expert's profile and performance. The final UI for the client homepage now includes:
A simplified Top Expert card showing the expert's name and area of expertise.
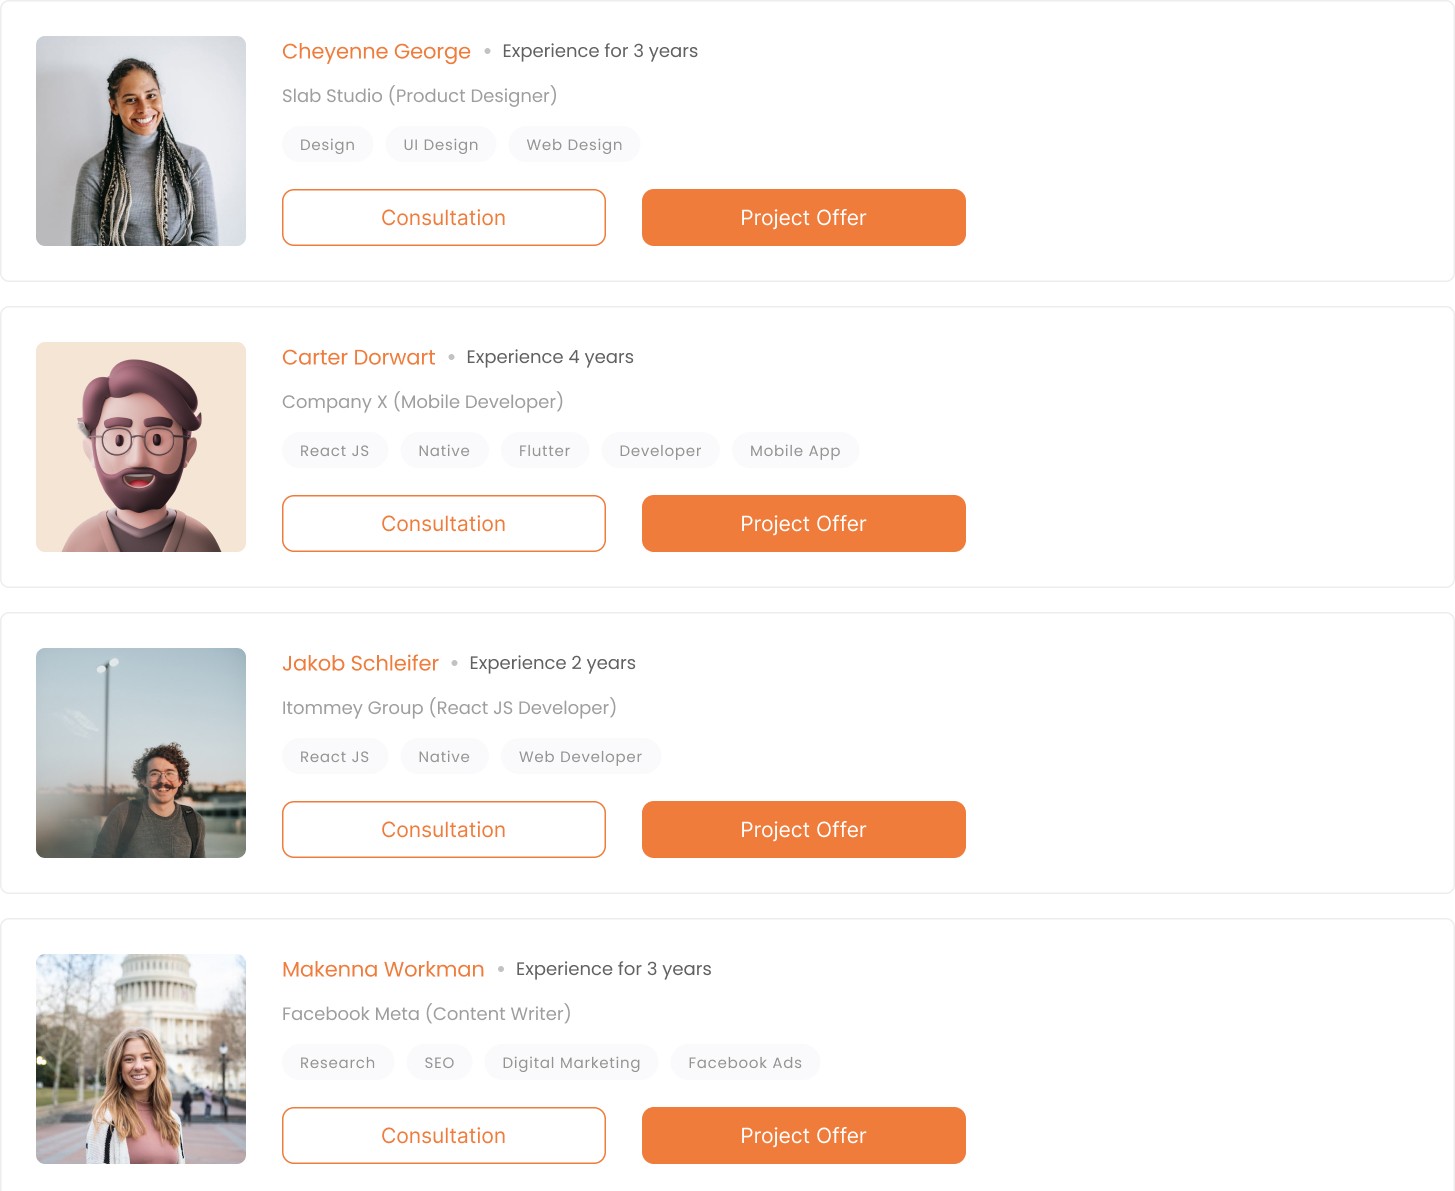
A clickable name that directs users to the expert's profile and project history.

This design minimizes UI complexity while ensuring that experts with the highest scores are given prominent visibility.